The Dashboard


You don't need to understand any of this information! That's the benefit you buy when you purchase a subscription. Details are shown here for those with knowledge in IT and networking. WE contact YOU if the Dashboard reports any cyber-security issues!
At a glance, the Dashboard shows:
- the last time the information on the screen was updated and the system file integrity.
- 1f your internet connection is working. If so the IPs will be listed in Green.
- your internet upload and download actual speeds.
- the last time something/someone tried to connect to the device, and the IP it came from.
- how long the device has been in continuous operation without restart, the CPU usage, and CPU temperature.
- the honeypot server status and total number of NIDS programs running.
- whether the connection processes are working correctly.
- the name of the status file that gets sent to CyderCloud.
- the operation of the dashboard viewing server and the IP to view it on.
- log and quick start information.
More Details of the CyderInc NIDS Dashboard:
Under the page title, the dashboard displays the last time any information was updated and the integrity of the files on the system. Every few minutes, the system runs a file scan to make sure the files have not been altered by a hacker or virus. In the event that corrupted files are found, they are replaced with pure files from the CyderCloud.
Next down on the page, you'll see the external IP address of your router and the IP address of the CyderNIDS. The system is consistently monitoring your internet connection for availability and speed. The Gateway (removed from picture for security) and LAN IP addresses show in green text if the internet is working and connected. Below those IP addresses are internet speeds. This helps you to know what your internet availability and download speeds are, since we pay for those download speeds. One quick note here, because of network traffic, you'll never get the full download speed you've purchased. The network has to share the bandwidth with other devices, so just like a highway, the more devices are using the network, the slower it gets.
Under the speeds, Intrusion information is shown. When a hacker or bot scans your network looking for devices to infect, they will also scan each device on your network. This is where the fake servers come in and pretend to be something they're not. They'll capture what the criminal is attempting to do and send that data back to CyderInc. The system will show you in a red font "INCURSION" and record the time and date. After a few minutes, the system will analyze the IP address where the INCURSION came from and perform a scan on it to determine what type of device it is and where it is located. Devices on your own network get a full scan so you can identify what device on your network has been infected. Devices on the internet get a quick and fully legal scan so CyderInc can let the server owners know their server has been infected and is spreading a virus.
Under the last incursion statistic is the uptime for the system. This show how long the system has been running since it was rebooted. Sometimes it is necessary to reboot a system due to memory corruption, so when troubleshooting, it is a good statistic to know. Often a reboot fixes problems.
Under the Uptime, the Dash shows Server Status. This is the honeypot server ( fake servers). Server status should be 'ok' and total CyderInc processes should be from 6 to 10, depending on what is happening in the system.
The dash also shows what IPs the honeypot server is listening on. When the CyderNIDS boots, it gets an IP from your router. Then it takes that IP and makes up to 13 other IP addresses to use to make the honeypot available on your network. This helps make sure that if someone is poking around in your network, they'll scan one of the honeypot IPs and get caught.
Next, the dash shows the status of the SSH program (used to securely upload/download files to/from CyderCloud), the log monitor, which notices when an INCURSION is happening and gives the alert, and the Dashboard Driver, which shows that the program that updates the dash page is still working.
Second up from the bottom shows the name of the identification file unique to this device. It is how the CyderCloud identifies the NIDS and alerts techs if the device needs help.
At the bottom of the screenshot, the IP address of the dashboard (p3server) is shown. Put this IP address into any browser connected to your network, and you can view the dashboard on that computer or device. It does require a username and password to view, which are provided with the NIDS device.
When you get your device, you'll notice there is a View NIDS Logs link at the bottom. This allows you to view all the information and logs that gets sent to CyderInc. 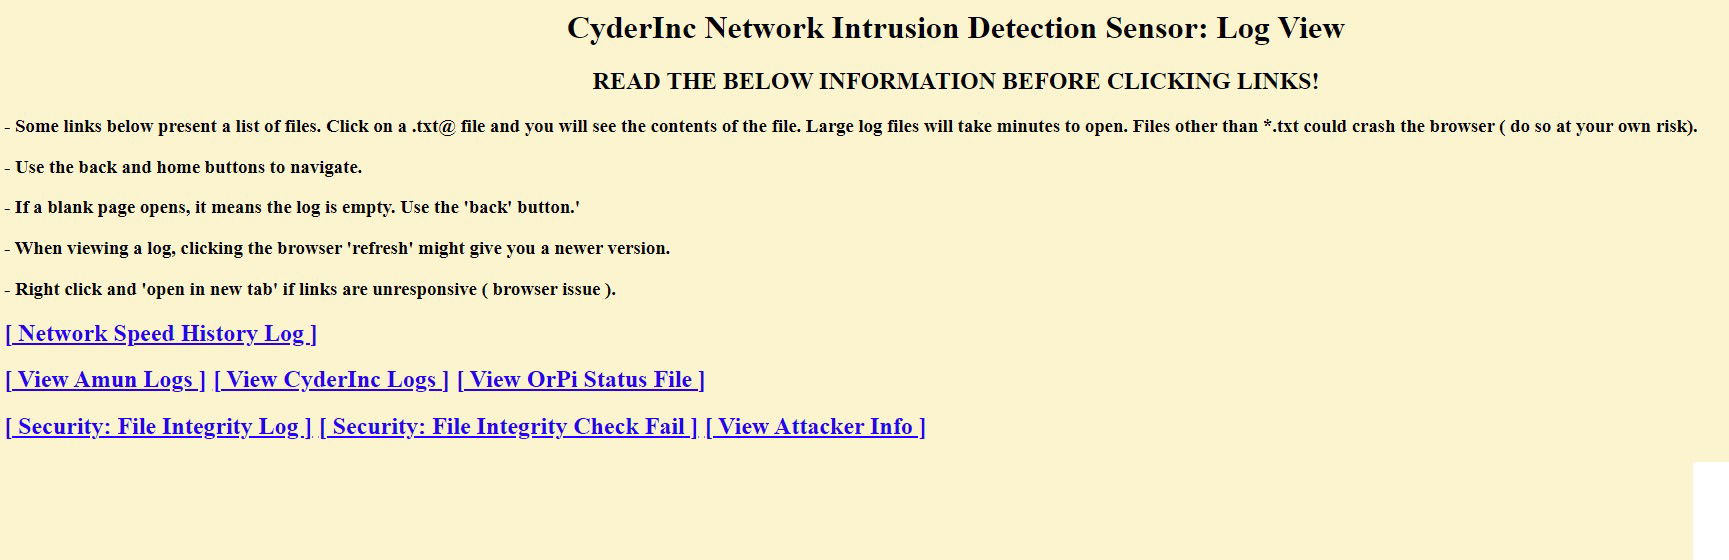
There is a link at the bottom of the dashboard page 2, to view the file that was created when the attacker was reverse scanned by the NIDS.
No personal browsing data is transmitted from your network, only information from and about this NIDS device, network addresses, and network status.